
Honey, wake up. Open your stocking. The 2024 Ofcom Online Nation Report is out.
Every year Ofcom look at what UK people are doing online and what they think about The Internet, then they publish this fun report. There’s also an interactive version.
Just like the internet itself, there’s lots of interesting, semi-surprising and sometimes disturbing details in it. So let’s look at some headlines and see what it might mean for you – a person who presumably has to do internet for a living.
Meta and Alphabet still rule
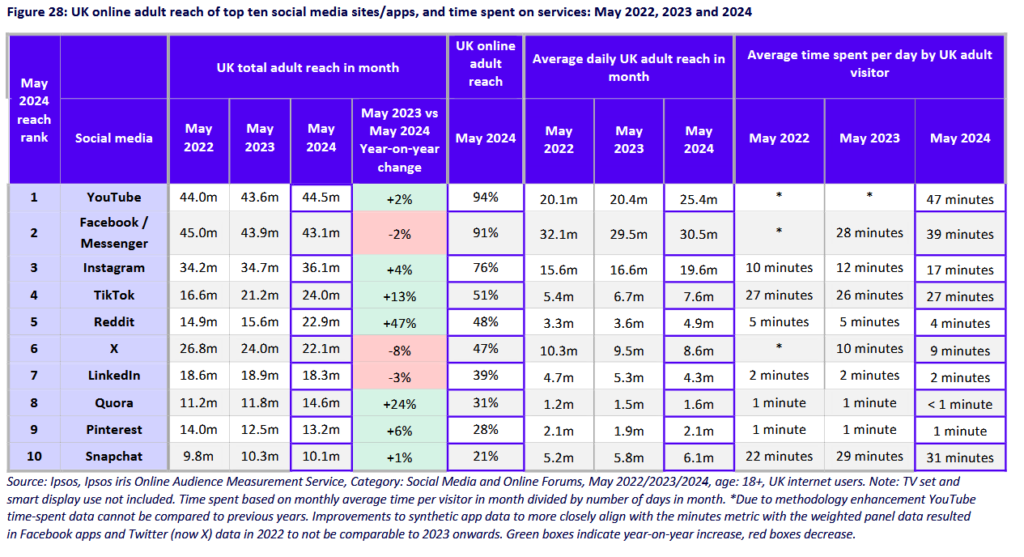
48% of all time spent online in the UK is spent on a service owned by Meta or Alphabet.
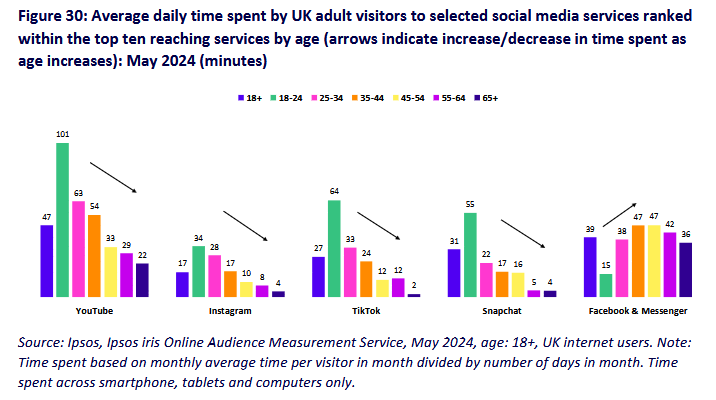
You might think ‘yeah we all Google things’, but 94% of people are visiting Youtube an average of 49 minutes per day. And 70% of adults are using Instagram, Facebook and Whatsapp all at once (unless you’re aged 18-24).
And that’s where the divergence is. I’ve been guilty of thinking the differences between Gen Z and other generations are overblown, and that actually millennials were the silent majorities on most platforms.
Nope. 18-24 year olds are spending an average of an hour per day on TikTok or Snapchat, and they account for 39% of all time spent on TikTok. 28% of those aged 65+ use TikTok, averaging out at 2 minutes every day.
X is tanking, Reddit is rising
Despite what Elon Musk says, people are using X less and less – specifically, 1.6m monthly users less. This report doesn’t account for the recent rapid rise of Bluesky as an alternative, and Threads remained in 12th place as the most-used social media app compares to X’s 6th place.
Reddit, however, has now overtaken X. Reddit is essentially a collection of forums focused on particular topics or communities, with a front page of posts which are upvoted or downvoted by users. Google recently gave it a boost in search rankings as it’s full of real people (for the most part) answering real questions, and is one of the last places on the internet to find lots of genuinely new information and conversation.
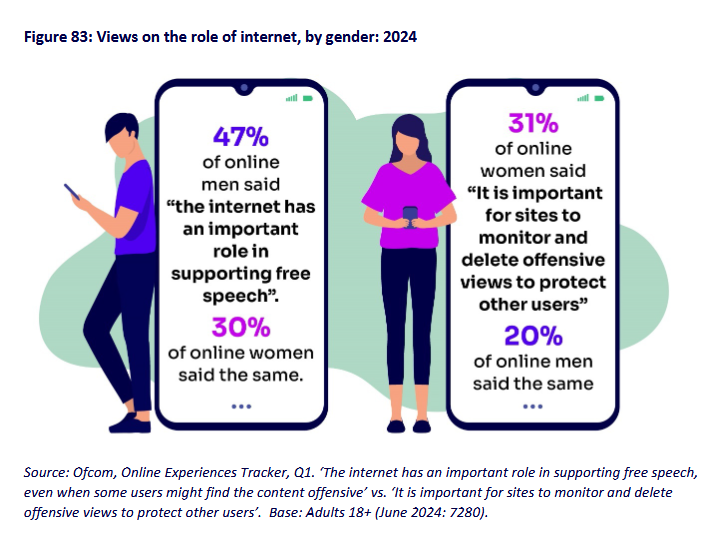
War of the genders
It’s…risky to generalise, but men and women tend to want different things out of the internet (more on that in the actual report), and they have wildly different experiences of it. The opposing sentiments in this graph, for instance, seem to be related to each other:
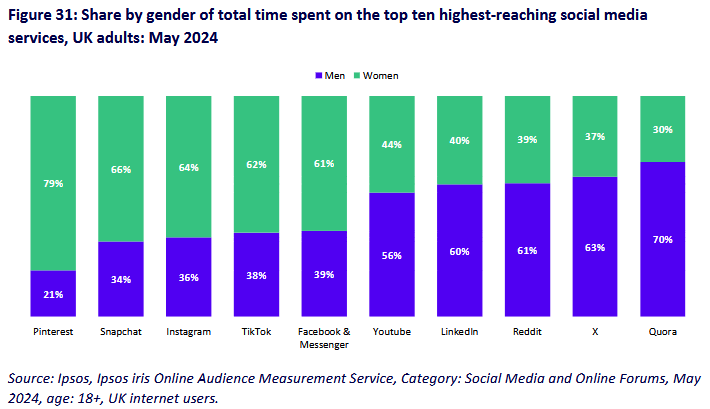
But there’s also a split in channel demographics. Men tend towards X – the ‘Nazi Channel’ – as well as Quora, Reddit and LinkedIn. Women tend to use Pinterest, Snapchat, Instagram and Facebook.
So what does any of this mean?
Well, at a very basic level you can use this kind of data to determine channel strategy. It’s clear where young people are and where you’ll reach the majority of UK people.
I haven’t even touched on other bits of data – for instance how 39% of users are encountering misinformation, or how essentially EVERYONE is using their smartphone rather than a PC.
But this is still only data, and data aggregated for the entire population. Your communities may buck the wider trends. You may find that while loads of people use Facebook, they’re actually really using Facebook Messenger and don’t give a toss what you post on your Business page.
That said, if I was still in charge of an organisation’s social media this is what I’d be doing:
- If you are targeting 18-24 year olds in any way, then you need to take TikTok seriously. It’s where they are. If people complain, show them the data.
- Reddit is worth experimenting with. It has its own rules – i.e. you’re not meant to self-promote – but almost all viral content starts on or makes its way onto Reddit. Try crossposting some of your stuff to relevant subreddits and engage in conversation where it’s relevant. This will be easier if you’re already a Reddit user (i.e. open it up compulsively every 15 minutes) and understand the ropes.
- Meta is still dominating social media. If Facebook isn’t working for you (and it isn’t working for a lot of people) reconsider how you use it – see this post wot I did about Facebook Groups. And don’t neglect Instagram – it’s the most stable and verstatile channel with a large audience that we have right now.
- YouTube is still huge. But it’s also very difficult. It needs dedication, skill and your content has to be useful, interesting or both. Some places do it really well – like the RI, the Tank Museum or Royal Armouries – but it’s only worth jumping into if you have an audience, a plan and you know what you’re doing. But if you do it well then it’s one of the only channels which could actually result in cold, hard cash.
- Don’t forget that a lot of social media use is through messaging apps – whether it’s Whatsapp or Facebook Messenger, or through Instagram’s DMs. Your event posts may not get clicks but keep an eye on whether they’re being shared via messages – and don’t forget that Reels are easier to share than other posts on Instagram.
When this kind of report is published it’s easy to be overwhelmed, and to try and do everything on every platform. Instead, use it as a tool. How can the data inform your strategy, to convince stakeholders or test a hypothesis?
Get a cup of tea. Read it through. Digest it. Sleep on it. Have some weetabix. Talk it over with a colleague. Eventually dredge up a memory of it when you do some content planning in 5 months time and remember that you need to post on Facebook.
Reach out
Interested in what I do and how I can help? Chatting to me is free, and I can work to your budget :)